Collect debug logs
Some problems are not about the network. A display renders wrongly, a button does nothing, a design behaves differently on the television than on your laptop. For those, what helps is a record of what the device was doing at the time.
UHT has a debug overlay for exactly that, and — like the connection test — it needs nothing installed.
Turning it on
Add /debug to the end of the address you are already on.
If the display is at
https://uht.app/display/1234
then go to
https://uht.app/display/1234/debug
It also works as a query parameter, ?debug=true, on any UHT address.
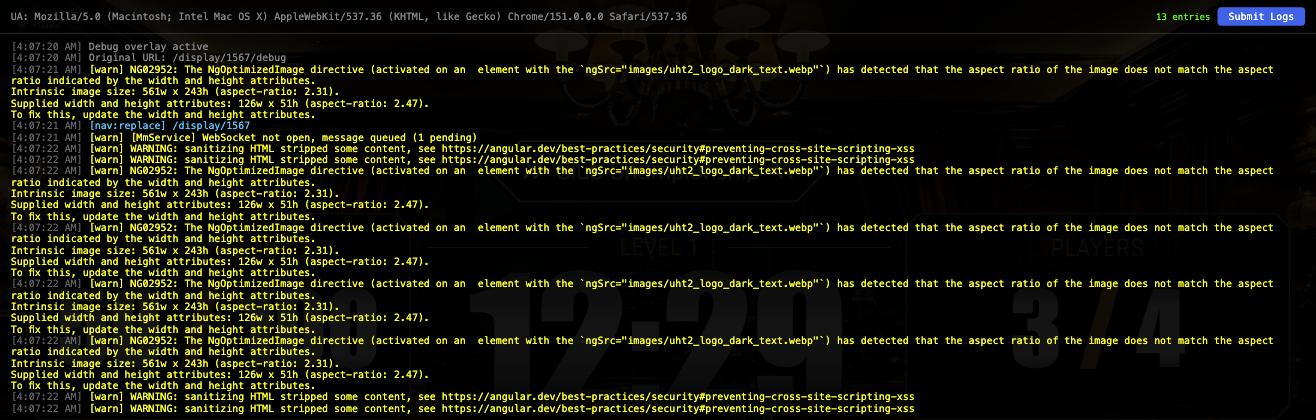
The page loads normally, with a log panel across the top:
What it records
The overlay captures everything the page reports about itself, colour-coded by severity:
| Colour | Kind | What it is |
|---|---|---|
| Red | error | Something failed |
| Yellow | warn | Something is not right but did not fail |
| Green | info | Normal activity worth recording |
| Cyan | nav | Navigation — the page moving between addresses |
| Grey | debug | The overlay's own notes |
Each line is timestamped, so you can match a log entry against the moment the problem appeared.
It records uncaught errors, unhandled promise rejections, everything written to the browser console, and every navigation — including redirects and back-button presses, which are a frequent cause of "it just went back to the home screen".
The header gives you the device's identity and the entry count:

The User-Agent string names the browser and operating system. On a smart TV, that one line often explains the whole problem.
Sending the log
Submit Logs at the top right sends the captured log to us.
That is the whole procedure: open the address with /debug, reproduce the problem, press
Submit Logs. Then mail contact@ultimate-holdem-timer.com
with what you did and roughly when, so we can match your description to the log.
If log submission is disabled on the server you will see a message saying so; in that case photograph or screenshot the overlay and attach that instead.
Using it well
Reproduce the problem while it is running. The overlay only captures what happens after it loads. Open it first, then do the thing that goes wrong.
Keep the sequence short. A log with fifteen entries around the failure is far more useful than eight hundred entries from an entire tournament. Load the debug URL, do the minimum that triggers the problem, submit.
Note the time. "It went wrong at about 21:47" lets us go straight to the right part of the log.
Run it on the device that misbehaves. Same rule as the connection test. A log from your laptop tells us nothing about the television.
Debug mode on a connected display
There is a second route for multi-monitor screens you cannot easily type a URL into. In the Connected Displays dialog, each device has a Reload in Debug Mode action:
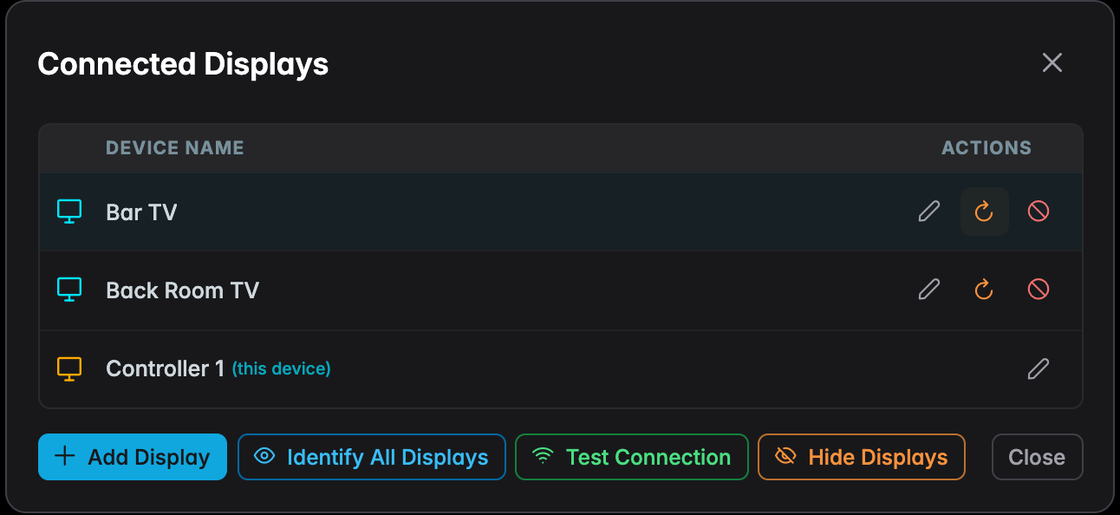
It reloads that screen with logging enabled, remotely. Much easier than finding a TV remote and editing an address.
Enabling it on the television does not put your phone into debug mode, and vice versa. Turn it on for the device that is actually misbehaving.
Which test to use
| Symptom | Use |
|---|---|
| Screen drops out, stutters, or lags | Connection test |
| Screen renders wrongly or looks broken | Debug logs |
| A button or dialog does nothing | Debug logs |
| Display shows stale numbers | Connection test first |
| The page navigates away by itself | Debug logs |
| Not sure | Both — they take a minute each |
Next
- Connection test — for network problems
- Something not working? — the common fixes first