Connection test
When a screen keeps dropping out or the clock stutters, the useful question is not "is the internet working?" but "is this device's connection to UHT healthy?"
UHT has a built-in test that answers it, and it needs nothing installed.
Running it
Add /conntest to the end of the address you are already on.
If the display is at
https://uht.app/display/1234
then go to
https://uht.app/display/1234/conntest
It also works as a query parameter — ?conntest=true on any UHT address — which is easier
on a device where editing the end of a URL is awkward.
The test measures the connection of whatever device it is open on. If the television is the one dropping out, run it on the television. Running it on your laptop tells you about your laptop.
Reading the results
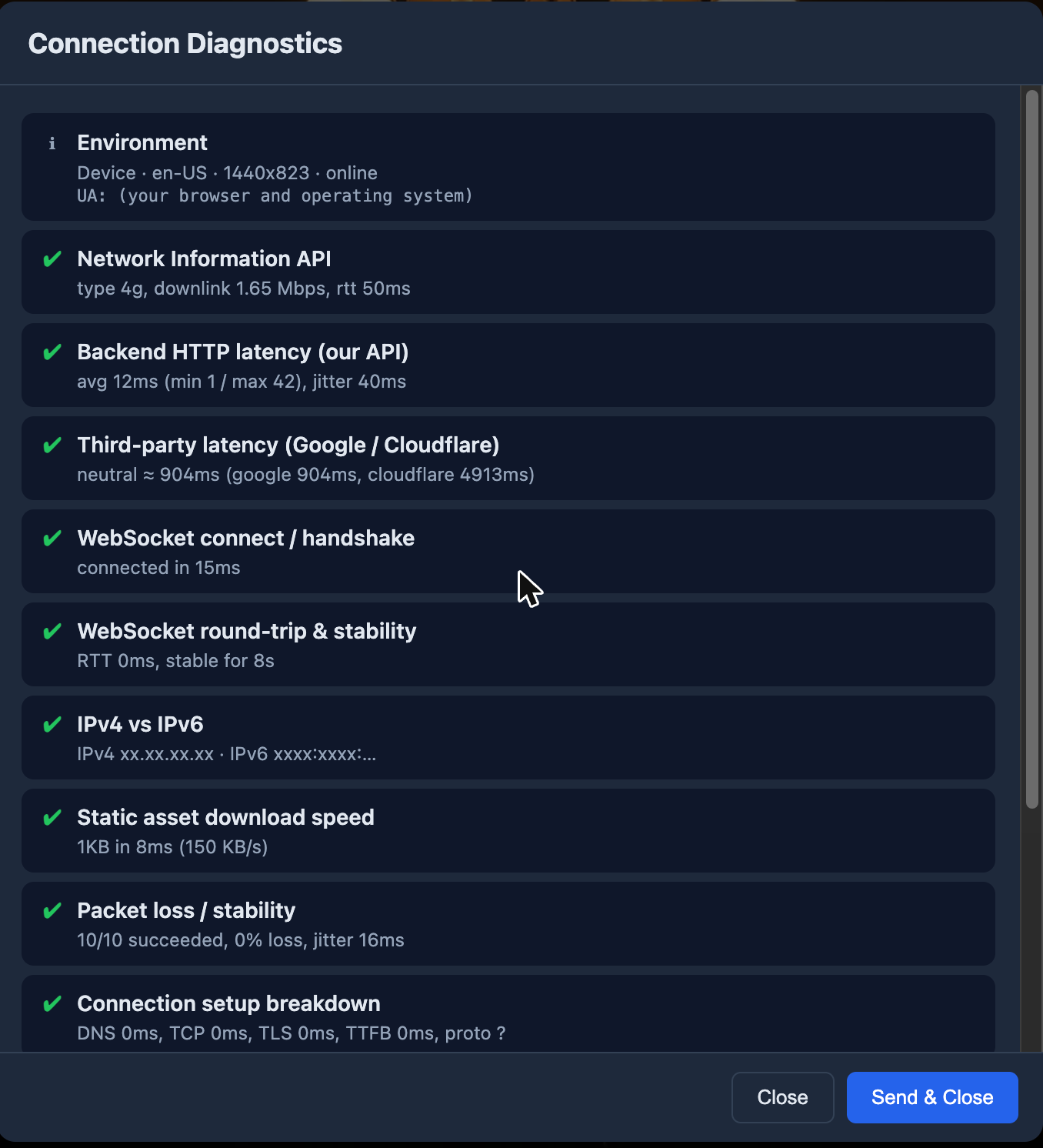
The test runs a sequence of checks and reports each one:
Environment — the browser and device it is running on. Worth a glance: an unexpectedly old browser version explains a great deal on its own.
Network Information API — the connection type the device reports, where it offers one.
Backend HTTP latency — how long UHT's servers take to answer. This is the baseline. Tens of milliseconds is good; hundreds means a slow path; timeouts mean no usable connection.
Third-party latency — the same measurement against an unrelated site. This is the control. If UHT is slow and the third party is fast, the problem is between you and UHT. If both are slow, the problem is the device's connection generally.
WebSocket connect & handshake — whether the live connection that keeps screens in sync can be established at all. A failure here with healthy HTTP is the signature of a firewall or captive portal blocking WebSockets — common in hotels, conference venues and corporate guest networks.
WebSocket round-trip & stability — how long messages take, and whether the connection holds. This is the measurement that matters for multi monitoring.
IPv4 vs IPv6 — which the device is using. Occasionally an IPv6 path is broken where IPv4 works.
Static asset download speed — bandwidth for the files a display needs to load.
Packet loss / stability — whether the connection drops packets. This is the usual culprit behind a screen that works but stutters.
Connection setup breakdown — where the time goes when establishing a connection: DNS, TCP, TLS.
Green across the board means the connection is fine and the problem is elsewhere — the device's browser, the design, or the display itself.
Sending us the results
The test has a Send & Close button. Press it.
This is by far the most useful thing you can provide for a connection problem: real measurements rather than a description of symptoms. "The TV keeps dropping out" and "the TV's WebSocket round-trip is 800 ms with 12% packet loss" lead to very different answers, and only one of them is actionable.
What the results usually mean
Everything green, screen still misbehaving. The connection is not your problem. Look at the device — an old smart-TV browser, or a design with heavy effects. See Multi monitoring for the device compatibility table.
HTTP fine, WebSocket fails. Something is blocking WebSockets. A guest wifi network, a captive portal, or a corporate firewall. Try the device on a phone hotspot: if it works there, the venue's network is the cause.
Everything slow, including the third party. The device's connection is weak. Smart TVs frequently have poor aerials — a streaming stick or an ethernet cable usually fixes it.
High packet loss, decent latency. Classic weak wifi. The connection works but loses messages, which is exactly what produces a screen that is nearly right but keeps drifting.
IPv6 failing, IPv4 fine. Rare, but it happens. Worth reporting, because it is not something you can fix at the venue.
The other test
The connection test measures one device against the internet. There is a second test that measures your connected displays against each other: Test Connection in the Connected Displays dialog, which pings every screen and shows each one's response time.
Use that one first to find which screen is bad, then /conntest on that screen to find
out why. See Multi monitoring.
Next
- Collect debug logs — for problems that are not about the network
- Something not working? — the common fixes
- Multi monitoring — connected displays and device compatibility